
By the time a crop looks stressed to the eye, the underlying condition may already have been developing for days. Chlorophyll content drifts before leaf colour visibly shifts. Canopy density thins before rows look sparse. This lag between the onset of stress and its visible symptoms is where a meaningful amount of preventable loss quietly accumulates.
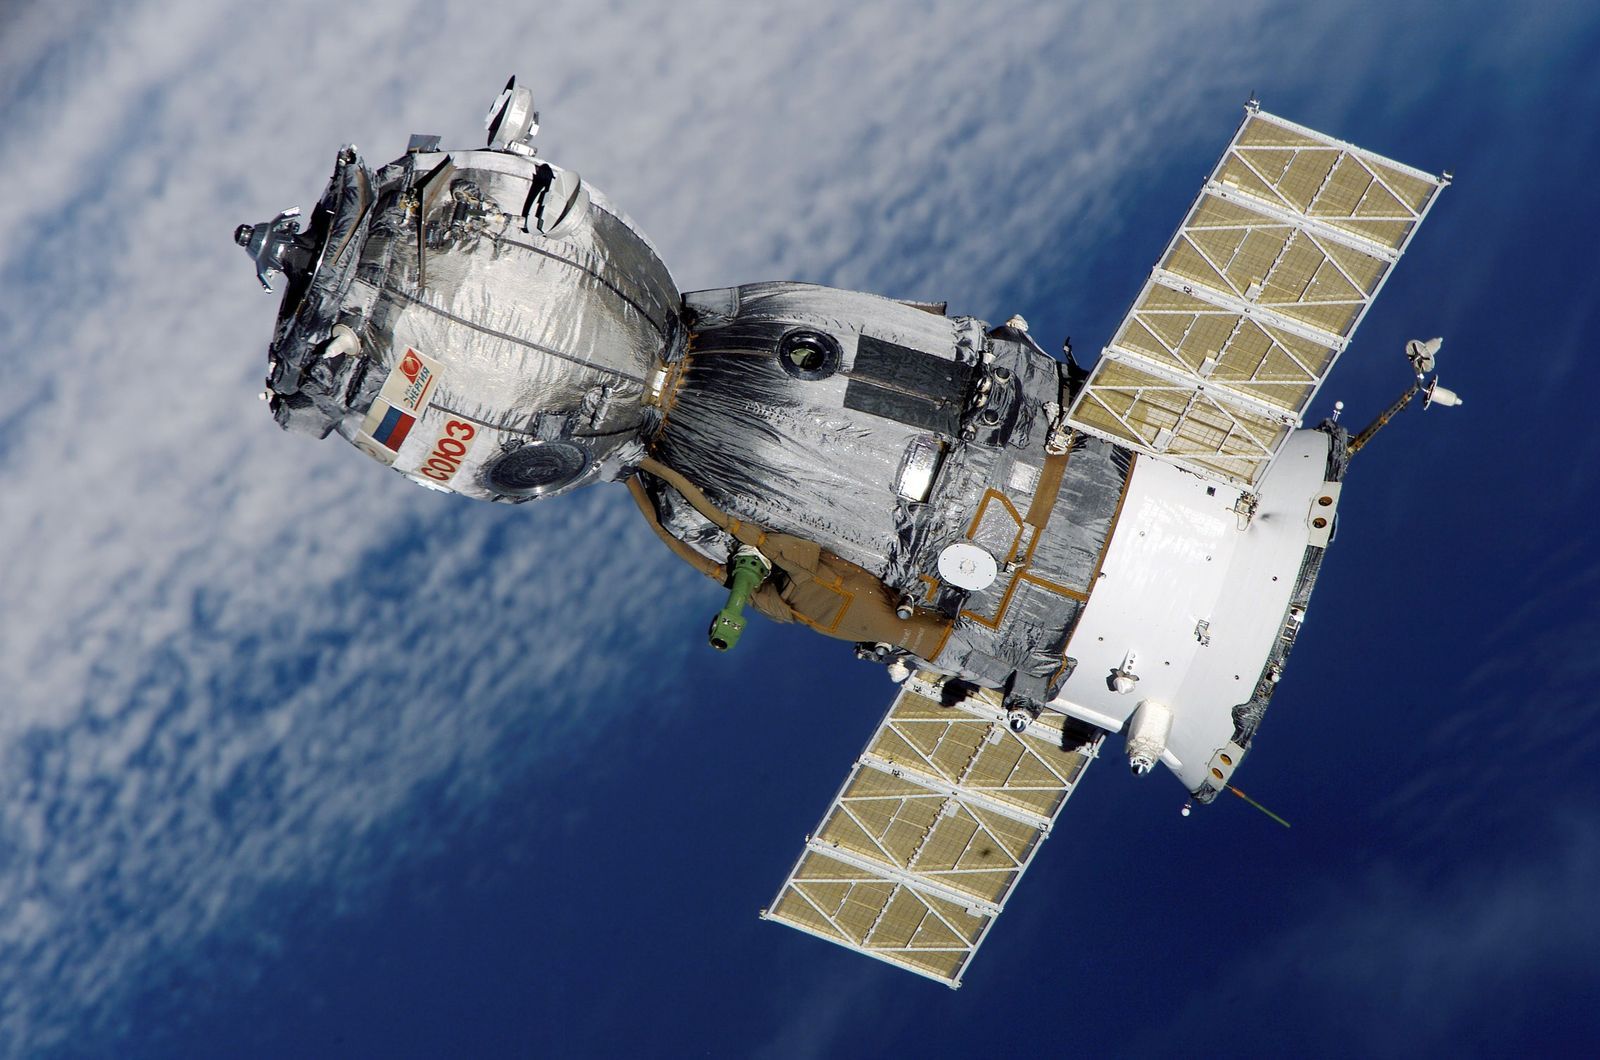
Satellite-based monitoring works in this gap. Multispectral imagery captures reflectance patterns across wavelengths the human eye cannot register, potentially surfacing variation in vigour, moisture and canopy structure before a routine field walk catches the same signal.
A single index value on its own is not particularly useful to a farmer or an agronomist. Its value comes from being layered against field boundaries, crop calendars, historical baselines and weather context, so a dip in an index can be read as "likely water stress in the northeast corner, consistent with the dry spell three days ago" rather than an abstract number.
What satellites can measure
ESA’s Sentinel-2 mission observes land in 13 spectral bands, with a 290-kilometre swath and a nominal five-day revisit for the two-satellite constellation. Four bands have 10-metre resolution, six have 20-metre resolution and three have 60-metre resolution. These specifications matter because different indicators describe different areas of the field; a detailed-looking map does not mean every layer was measured at the same resolution. ESA mission overview and instrument specifications explain the distinction.
At 10-metre resolution, a pixel represents 100 square metres. A one-hectare square field therefore contains about 100 nominal pixels before boundary effects and unusable observations are considered. That simple calculation illustrates both the opportunity and the constraint: broad patterns can be visible, while narrow strips, intercropping and small patches may be mixed together. A field boundary must be checked before treating a coloured patch as a crop-specific observation.
Read the trajectory before the alert
Vegetation indices compress reflectance measurements into interpretable signals. NASA explains that the Normalized Difference Vegetation Index, or NDVI, uses the contrast between red and near-infrared reflectance. Its guide to NDVI and EVI also explains why dense vegetation can saturate NDVI and why clouds and aerosols can obscure the surface. A declining index is evidence of a changing canopy signal, not a diagnosis of a particular pest or nutrient deficiency.
The useful comparison is with the field’s expected development at the same crop stage. Harvest, delayed sowing, natural senescence and a recent management operation can all alter the trajectory. An agronomist should ask whether the change persists across usable observations, whether neighbouring fields show a similar pattern, and whether rainfall or irrigation records support the suspected explanation. These checks help separate a developing crop problem from an image artefact or an expected seasonal transition.
Observation frequency is an operational constraint
Combining missions can improve temporal coverage. NASA reported that Harmonized Landsat and Sentinel-2 Version 2.0 achieved a global median repeat frequency of 1.6 days in 2022, combining four satellites. The harmonized product uses 30-metre resolution. Those are documented dataset characteristics, not a promise of cloud-free imagery every 1.6 days for an individual farm. NASA’s 2025 HLS review describes both the product and its applications.
Cloud cover can leave a gap during the exact period when a decision is urgent. The service should therefore show the acquisition date, valid coverage and quality of the latest image. A modelled estimate between observations should be labelled as an estimate. If the evidence is stale, a field visit, local sensor reading or farmer call may be more useful than waiting for the next clear scene. Early detection depends on this complete observation and response chain.
Turn the signal into a field task
Consider an illustrative irrigation review. A persistent decline appears in one part of a field after a dry spell. The team checks crop stage and irrigation history, then visits the affected patch and an apparently healthy comparison area. A blocked outlet might explain the pattern; alternatively, field evidence might point towards drainage or soil variation. The appropriate response follows the verified cause. The image determines where to investigate, while agronomy determines what action is justified.
For an enterprise, the performance measures should include time from observation to review, the share of alerts confirmed in the field, missed problems found during independent scouting, and the time available to intervene. A visually impressive dashboard is insufficient evidence of avoided loss. Yield or input-saving claims require comparison against a credible baseline, with weather and management differences accounted for.
This is the practical connection to What the Field Knows That Data Alone Cannot Tell Us: remote monitoring becomes more useful when observations return from the ground. Agriculture Has Data. What It Often Lacks Is Context. explains how those records should be connected. For agricultural intelligence, the aim is to bring a defensible, located question to the right person early enough for the answer to matter.
Sources
- ESA — Sentinel 2 mission overview — Mission reference.
- ESA — Sentinel 2 instrument specifications — Technical reference.
- NASA — Measuring Vegetation with NDVI and EVI — Foundational technical reference.
- NASA — Harmonized Landsat and Sentinel 2 — 2025; repeat-frequency measurement from 2022.